Percentiles Can Be Misleading
You just launched axolitl.com, a website that sends you an axolotl picture to brighten your mood. To do this, it fetches one hundred random pictures, each from a different image provider, and selects the cutest picture.
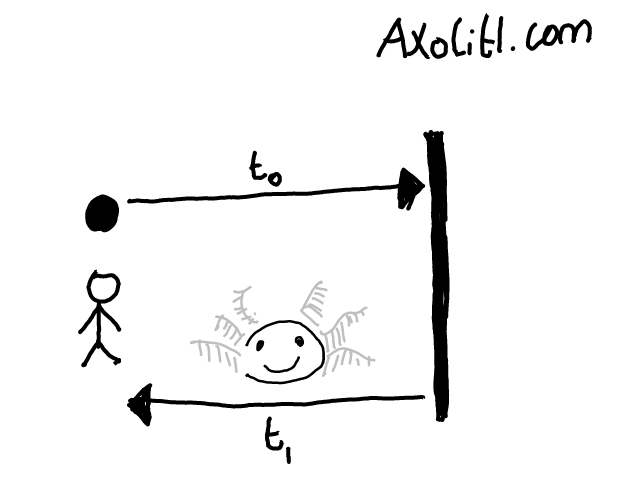
It would be tragic if people had to wait too long to see a cute axolotl, so you’re trying to improve your website’s performance. You’ve chosen one second as your target load-time, and you’ve collected 1,000 performance samples showing how quickly your site runs in practice.

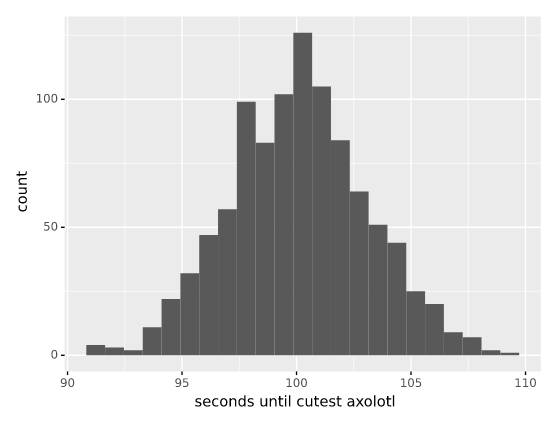
Your first version of the website made requests sequentially; it fetched an axolotl picture from the first site, then the second, and so on in order. This was really slow; it took about one hundred seconds on average to return the cutest axolotl to your user.
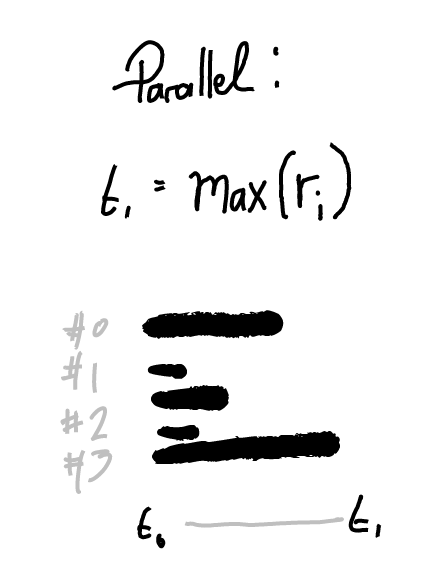
You refactored axolitl.com to fetch from the one hundred axolotl sites simultaneously, then send the cutest back to the user after all 100 sites have returned an image to you.
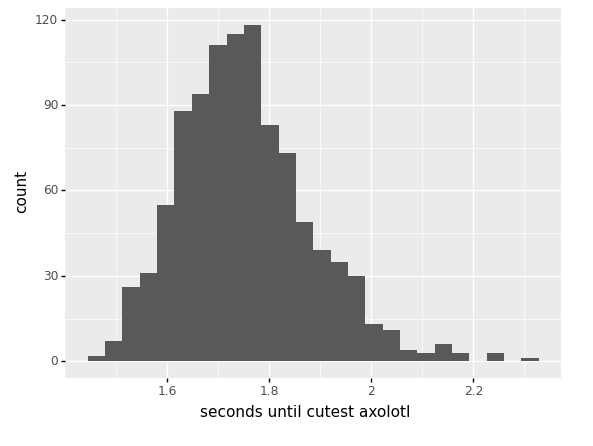
this is much faster! it only takes about 1.8 seconds to find the cutest axolotl and send it to your user.
You still want to make things faster, so you want to identify which is the slowest image-provider to respond, so you compute the median seconds to respond for the hundred image-providers you are using.
servername  median request time in milliseconds
server0     1001.277758
server1     1012.431285
server10     998.604213
server11    1013.141448
server12    1013.893294
...
server95     984.588889
server96    1011.991945
server97     991.205788
server98    1002.939200
server99     976.869488
and then you work the average response time and how much it varies across the hundred image-providers.
count     1000
mean     1000.584966
std        12.858177
min       957.161377
max      1028.891806
ok; so the image-providers take about one second to respond with an axolotl picture on average, so it’s not an issue with any of the image-providers themselves. There’s no real difference in performance between any of the image-providers, so we’ll treat them as completely interchangably. But why is it taking nearly two seconds for axolitl.com to return the cutest axolotl?

Sometimes an image-request will be a little slower or a little faster than average. You look at the variation for a random image-provider, server #31. For server #31, you see most requests take around one second, but some take as little as 300ms and as long as 2.1s
axolitl.com takes about 1.8 seconds on average, so you graph server #31 (red), server #89 (blue), and axolitl (green)'s performance on the same graph to compare.

Axolitl is behaving very differently to the image-providers its using! It’s much slower on average, and there’s less variation in request-speed for axolitl.com than the various axolotl-supplying image-providers.
You can quantify this variation in request-times using percentiles.
In our data-set we have 1,000 performance measurements per server, these measurements average to about one second. To compute the percentiles, sort the 1,000 requests from fastest to slowest and select from that list as follows:
- : select position 10 from the 1,000 sorted requests-times; less than 1% of requests ran faster than p1
- : select position 500 from the 1,000 sorted request-times, which will give the average request-speed and in this case will be close to the median
- : select position 750 from the 1,000 sorted request-times, only 250 or 25 of requests ran more slowly.
And so on.

Server #31
%ile   seconds
p1     0.344620656
p5     0.505611475
p25    0.787659725
p50    1.010187031
p75    1.180701456
p75    1.180701456
p95    1.478069191
p99    1.674983957
so only about 1% of requests to server #31 take more than 1.6% to respond with an axolotl. You check all the other servers, and the numbers are roughly the same. So where is axolitl.com’s 2.1s coming from?
We are making one hundred requests for axolotl images in parallel, and axolitl has to wait for all one hundred requests before finishing. If 99 servers return quickly, but server #76 happens to return slowly through change, then axolitl can’t return the cutest picture until #76 is finished! What is the slowest image-server response time for each request?

That’s it! Even though the image-providers take about one on average and about 1.4s one in twenty-five times (), axolitl has to wait on the slowest of the one hundred requests and through chance one of the requests , , or worse! The percentiles for server #31 were misleading, since they don’t take the number of requests you are making into account.
Is there a way we can account for the number of requests being made when estimating how long the overall request takes? Yes, but first, some basic probability.
There’s a 95% chance a request will take less time than the . The probability of two requests taking both less time than 95% is 95% x 95% = 0.9025%.

We can generalise this; the probability of requests taking less than the of that server is . In our case of one hundred requests, there’s a 0.59% probability that all one hundred simultaneous requests take less than the of 1.47$ we measured for a random image-provider! We almost always see performance for this server!
What is our expected average performance?
given requests is given one request
In our case, the “combined” for axolitl.com is actually the image-providers response-time, which is measured as approximately 1.692 seconds for image-server #31. Lets pool the timing data for image-server #0 through #99 (one hundred thousand requests total) to compute each combined percentiles accurately.
These combined percentiles accurately describe the slowest image-provider data we encountered earlier, which is reassuring. We now understand that axolitl.com was running into the the of one of its axolotl image-providers every time a user connected, resulting in a 1.739 second load-time rather than the 1s response time we would expect looking at each image-providers individual percentiles and timing-data.
Armed with this knowledge about the effect of request-count on load-times, you decide to refactor axolitl.com to use a background-job to sync axolotl pictures continually to your server’s SSD, so you can quickly serve the cutest axolotl pictures from disk well inside of your one second target!

Takeaway Points
This hypothetical story warns us that almost all server-requests and front-end page-loads that in turn perform multiple network requests will receive , , or worse response-times for some dependency requests. is not rare, and a dependencies’ worst-case performance must be examined and presumed common rather than too rare to worry about. The frontend often makes hundreds of requests and blocks load on many of them, so this model is applicable in the real-world.
Following our “all-dependencies-have-the-same-response-time” model from earlier, we can see just how common high-percentile response-times are for real-wold services.
reqs combined-p50
1    0.5
2    0.7071067811865476
5    0.8705505632961241
10   0.9330329915368074
20   0.9659363289248456
50   0.9862327044933592
100  0.9930924954370359